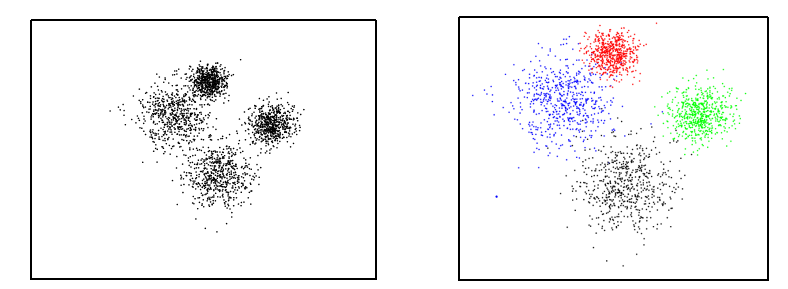
1
2
3
4
5
6
7
8
9
10
11
12
13
14
15
16
17
18
19
20
21
22
23
24
25
26
27
28
29
30
31
32
33
34
35
36
37
38
39
40
41
42
43
44
45
46
47
48
49
50
51
52
53
54
55
56
57
58
59
60
61
62
| import numpy as np
import matplotlib.pyplot as plt
%matplotlib
data = np.loadtxt('Lab4.dat')
def calSSE(X, cidx, ctrs) :
SSE = 0
for i, ctr in enumerate(ctrs) :
SSE += np.sum(np.square(X[np.where(cidx == i + 1)] - ctr))
return SSE / X.shape[0]
def kmeans(X, K) :
center_point = []
for i in range(K) :
point_x = np.random.uniform(np.min(X, axis = 0)[0], np.max(X, axis = 0)[0])
point_y = np.random.uniform(np.min(X, axis = 0)[1], np.max(X, axis = 0)[1])
center_point.append([point_x, point_y])
center_point = np.array(center_point)
cluter = np.zeros(X.shape[0]).astype(np.int32)
item = 5
while item > 0:
for i in range(X.shape[0]) :
distance = center_point
distance = np.sum(np.square(distance - X[i]), axis = 1)
cluter[i] = np.argmin(distance) + 1
New_center_point = np.zeros((K, 2))
for i in range(K) :
New_center_point[i][0] = np.mean(X[np.where(cluter == i + 1), 0])
New_center_point[i][1] = np.mean(X[np.where(cluter == i + 1), 1])
if (New_center_point - center_point < 1e-7).all() :
break
center_point = New_center_point
item -= 1
return cluter, center_point
SSE = []
mark = [ 'r', 'c', 'y', 'k', 'm', 'g']
plt.ion()
for K in range(2, 7) :
cidx, ctrs = kmeans(data, K)
ctrs_set.append(ctrs)
print(f'K为{K}时的簇心 : \n {ctrs}')
SSE.append(calSSE(data, cidx, ctrs))
plt.subplot(2, 3, K - 1)
for i in range(K) :
plt.scatter(data[np.where(cidx == i + 1), 0], data[np.where(cidx == i + 1), 1], marker = '.', color = mark[i])
plt.scatter(ctrs[ : , 0], ctrs[ : , 1], marker = '*', color = 'g')
plt.title(f'K is {K}')
plt.tight_layout()
plt.xticks([]), plt.yticks([])
plt.figure()
plt.plot(list(range(2, 7)), SSE, '+--')
plt.ioff()
plt.show()
|


